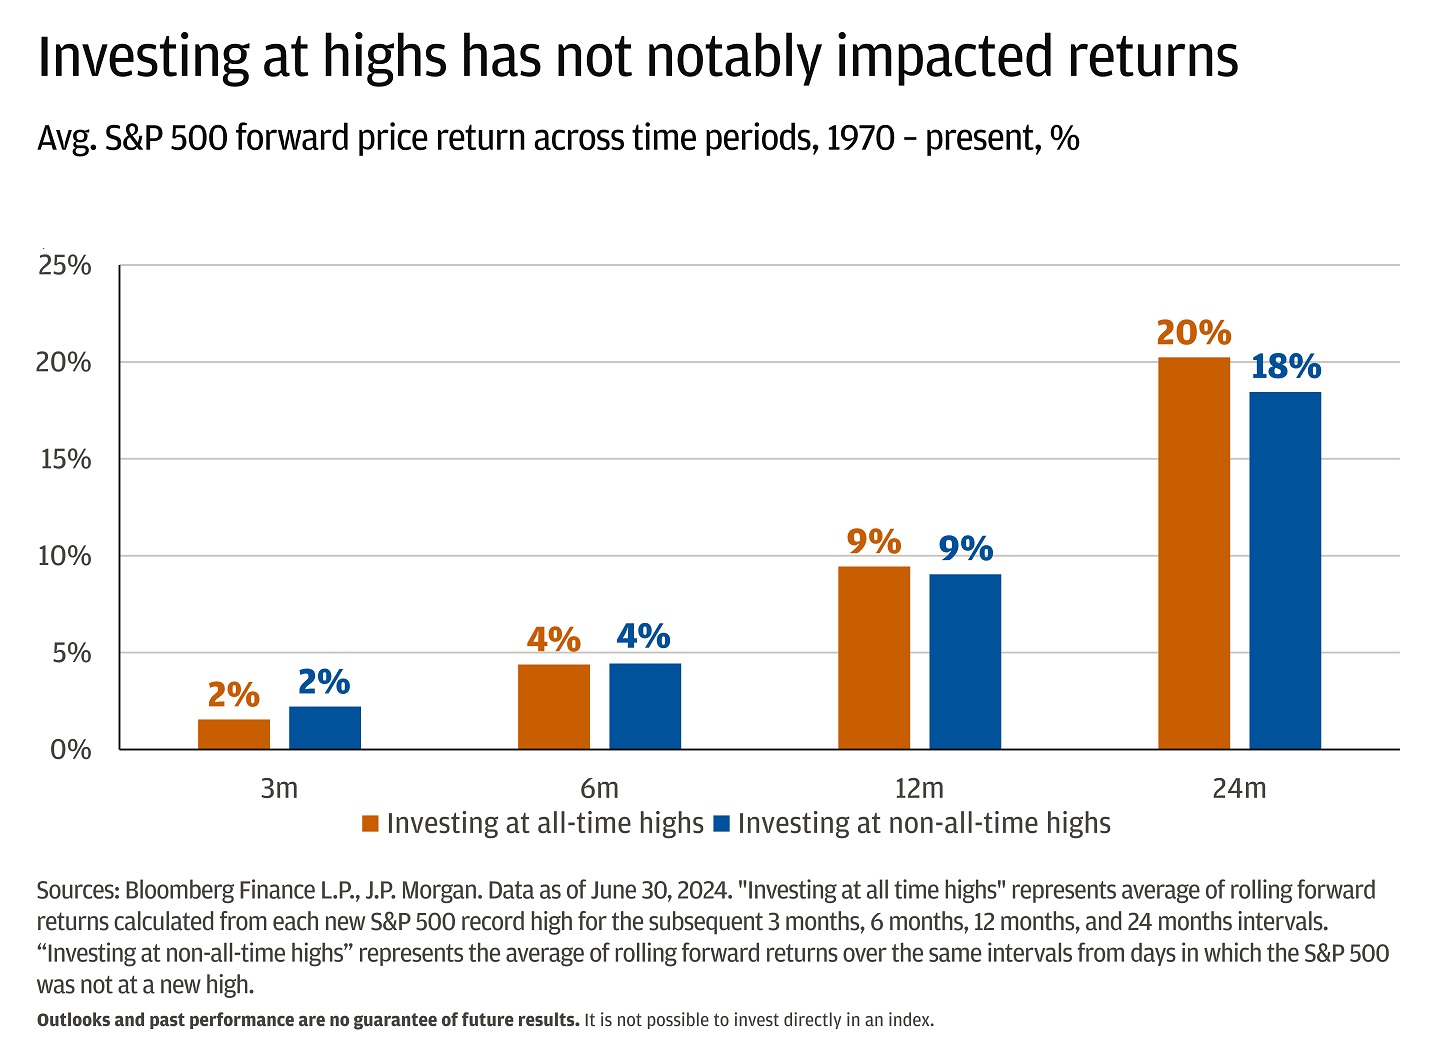
J.P. Morgan Asset Management reports that buying at ATHs in popular ETFs like the S&P 500 has minimal impact on long-term performance. In fact, history shows investors can benefit from investing at ATHs rather than waiting for a dip.
More details can be found here.
This repository aims to provide a reproducible answer to that question. By simulating historical leveraged data and backtesting return rates, it seeks to analyze the risks and rewards of investing in leveraged portfolios during market highs in a reproducible manner.
| File | What it does |
|---|---|
Demo-Single-Stock.ipynb |
Simulates and backtests the return rates of a single stock selected by the user. |
Demo-Portfolio.ipynb |
Simulates and backtests the return rates of a porfolio of stocks selected by the user. |
utilities.py |
Provides callable functions for data preprocessing, return calculations, and plotting. |
⭐ Backtesting with leveraged Shiller data from the 1800s reveals that historically, investing at or near 52-week highs has been less risky and more stable compared to investing at or near all-time highs.
⭐ Leveraging a portfolio of stocks reduces risk compared to leveraging a single stock.
⭐ Investing at an all-time high in portfolio price carries more momentum than investing at a 52-week high.
| When Buying On or Near an All-Time High | When Buying On or Near a 52-Week High |
|---|---|
 |
 |
Similarly to above we can apply a 2x leverage multiplier to the daily returns of $SPY, equivalent to $SPUU.
| When Buying On or Near an All-Time High | When Buying On or Near a 52-Week High |
|---|---|
 |
 |
We can visualize the All-Time High returns with side-by-side charts comparing 3X leveraged and unleveraged performance, using the same high-point buy strategy but with different purchase timings for leveraged and unleveraged cases.

If we’re concerned that the simulated timeframe isn’t representative, we could use Shiller Data, which includes historical returns for large-cap U.S. stocks such as the S&P 500, dating back to the 1800s. This would help us better understand how leveraging the S&P 500 performs across various market conditions. The following plots are 3X leveraged.
| When Buying On or Near an All-Time High | When Buying On or Near a 52-Week High |
|---|---|
 |
 |
When backtesting with Shiller data, we find that investing at or near all-time highs performs poorly, whereas buying at 52-week highs shows stronger outcomes. Let’s now examine how leveraged and unleveraged performance compares over our holding periods of interest (e.g., 1–2 years).

Applying a 3x leverage multiplier to the daily returns of $QQQ, $SPY, and $SOXX (equivalent to $TQQQ, $UPRO, and $SOXL), with $TQQQ representing 60% of the portfolio, $UPRO 20%, and $SOXL 20%.
| When Buying On or Near an All-Time High | When Buying On or Near a 52-Week High |
|---|---|
 |
 |
The return spread appears similar in the side-by-side charts comparing leveraged and unleveraged performance, with the unleveraged portfolio outperforming on average until the 4-year mark, after which the leveraged portfolio takes the lead.

